
Thursday, December 12, 2013
Monday, December 9, 2013
Extra Credit Option 2: Top 10 Maps
5 Favorite Student Maps

I like how Gardy used the U.S. map with North Carolina box. Also, data was easy to read.

I like how Jon used the service images and the American flag in the background.

I like how Nicole used the title and legend.

I like how Thomas used the faces of the candidates.
5 Weekly Blogs Maps

I like this choropleth map because I'm a hockey fan.

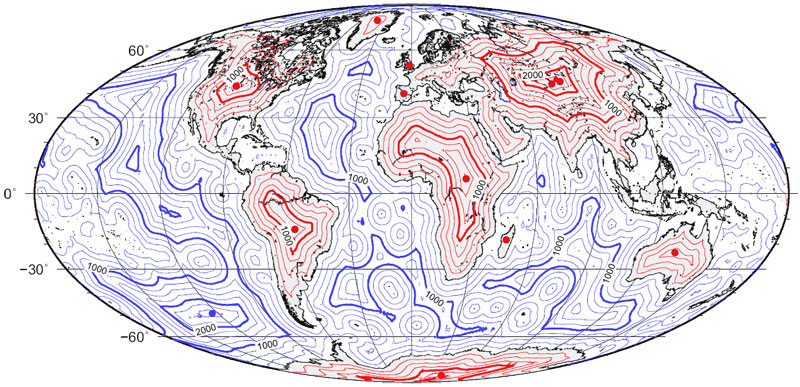
I like the contrast between the dark and purple colors.

I like how the artist used water colors and the artwork in the map.

I like this map because it tracks the typhoon by time and day.
I like how Gardy used the U.S. map with North Carolina box. Also, data was easy to read.
I like how Jon used the service images and the American flag in the background.

I like how Nicole used the title and legend.
I like how Thomas used the faces of the candidates.
5 Weekly Blogs Maps
I like this choropleth map because I'm a hockey fan.
I like the contrast between the dark and purple colors.
I like how the artist used water colors and the artwork in the map.
I like this map because it tracks the typhoon by time and day.
Thursday, December 5, 2013

Monday, November 18, 2013

Thursday, November 14, 2013


Tuesday, November 12, 2013

Thursday, November 7, 2013
Final Project
Final
Project
For my final project, I am mapping organic farms in Virginia
together with their retail and distribution outlets. I will compare this with the median income of
Virginia counties to show locations of likely consumers.
The reason why I choose organic farms is because I watched a
documentary on TV and was astounded by the way the majority of farm animals, which make up our meat
supply, were given drugs to artificially increase their growth. Additionally, these animals were inhumanely
treated and this could in the long run be associated with poor health of America.
My map audience will be
health conscious consumers who are looking for an alternative to factory farmed
animals are routinely given hormones and antibiotics. These drugs collect in the fat of the animals
and subsequently wind up in the meat and milk that we consume. This could also be used by the organic farms
to find new retail outlets for their products
The type of map I am envisioning for this project is a combination of location and choropleth.
The scope of my map will be Virginia.
The source of my data will be Certified Naturally Grown
Farms website (www.naturallygrown.org/farms/list/227/va)
and Farmer’s Pal website (www.farmerspal.com/organic-grocers-and-markets). The median income data will come from the
Census Bureau (www.census.gov).
Base map needed for this project is just a simple Virginia
map, with ancillary layer of counties. Counties
will be shades of green indicating the amount of income per county. Other layers will contain the data of the
organic farms and another layer will contain the retail outlets. These will be reflected on the map in the dot
density style.
I expect production to begin the week of November 11th.
I will start by collecting the data then
creating my base maps. After that I will
coordinate the colors and finally add in neatline, title, scale, and legend.
Challenges I perceive will be if the retail or distribution
centers are too close together. The farms
should be far enough apart to be identified.
I think my map will look similar to this.

I think my map will look similar to this.


Tuesday, October 29, 2013

Monday, October 21, 2013

Wednesday, October 16, 2013
Lab #6 Color Choropleth Map

Comparison between the web and printed Choropleth Maps
The only noticeable difference I saw between the web version of the map and the printed map was the background. The printed version's background was slightly darker than that of the web version. The contrast of the background color and the color of the map made the map easier to read and identify the data that the states represented.
Thursday, October 10, 2013


Thursday, October 3, 2013


Thursday, September 26, 2013

Tuesday, September 24, 2013

Monday, September 16, 2013


Monday, September 9, 2013

Thursday, August 29, 2013
Map of Obesity in Adults

Obesity based on weight.
I found this map interesting because it shows that obesity in southern states continue to be a growing problem due to low amounts of physical activity.
http://globalmonitoring.sdstate.edu/projects/obesity/ObesityandAssociatedRiskFactors.php?collection=Obesity+and+Associated+Risk+Factors
Subscribe to:
Comments (Atom)